 Photo: Jonathan Torgovnik/Getty Images Reportage
Last week, we attended the Cartagena Data Festival in Colombia, where more than 450 participants from many disciplines joined forces in a three-day event focused on solving critical gaps in global development data and creating opportunities for improved data collection for the post-2015 development agenda.
The proposed Sustainable Development Goals include a commitment to “achieve gender equality and empower all women and girls.” To monitor progress toward this goal and other goals for health, education, and poverty reduction, data disaggregated by sex will be needed.
Data2X, which works to build partnerships for better data for girls and women, introduced a session on data disaggregation as part of a program titled “Counting What Counts.”
Disaggregation means breaking down sets of data into smaller subpopulations. Wherever possible, data should be disaggregated by sex, at a minimum, and by age, ethnicity, geography, and other characteristics important for understanding what is happening at more granular levels.
Disaggregation allows for targeted policy and tracking those who are at risk of being left behind. But there is a downside to disaggregation: Costs increase with the larger sample sizes required to identify smaller units, as does the risk that individuals may be identified. So disaggregation must be carried out with a careful understanding of the sources and limitations of data.
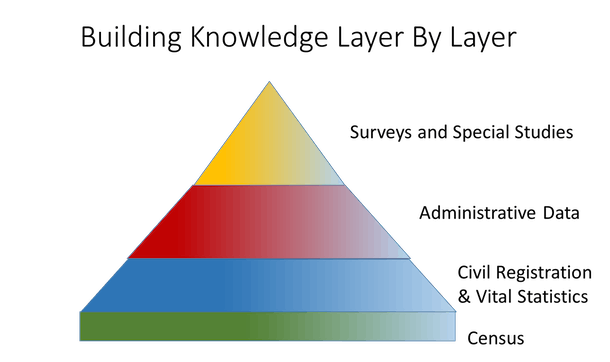
In our discussion of the sources of gender data, we used the metaphor of a pyramid, a symbol of power and also hidden secrets. We all know that it’s built from blocks of stone, but how, exactly, remains a mystery. And so it is a representation of our understanding of data. Where does it come from? How is it built? What can we do with it?
The pyramid represents the hierarchy of data gathered through conventional statistics. Each layer depends upon the next. As we rise up the pyramid, the number of individuals represented grows smaller but the complexity often increases.

- The base of our pyramid is the census. Censuses form the base for social and demographic statistics, and provide information on age, sex, location of the population, and housing conditions. It should count every person in a country.
- Above it rests the system of civil registration and vital statistics, which should record every birth, adoption, marriage, divorce, and death.
- Administrative data record the operations of government and its interaction with individuals, groups, and businesses. They are the major source of information on the functioning of social services, economic activity, and infrastructure.
- Surveys provide in-depth data across multiple domains on individuals, households, firms, and other actors. Surveys can gather more complex data, permitting deeper analysis of specific topics. Where civil registration and vital statistics and administrative data sources are weak, surveys are often used to estimate missing values.
The first two layers are key sources of individual-level data. Completing those would go a long way in filling gender and other data gaps and provide the base we need to maximize the utility of the top layers. New data sources, such as cell phone, internet activity, and geospatial data are emerging to add even more layers to the pyramid.
The participants at the Cartagena Data Festival were acutely aware that we are engaged in a data revolution. New sources of data and new methods of collecting, analyzing, and sharing data are changing our understanding of the world. And with these innovations comes a responsibility to include those who have been traditionally left out of the statistical record.
By Eric Swanson, Managing Director for Open Data Watch and Rebecca Furst-Nichols, Program Officer for Data2X


 View All Blog Posts